Blue Lines + Future Coral

In March 2022, we were fortunate to be participating artists in Data Through Design (DxD) 2022 exhibit, titled “Ground Truth IRL” at The Hall gallery space in Brooklyn Navy Yards. As described by DxD, the exhibition featured works that “creatively analyze, interpret and interrogate data made available in NYC’s Open Data Portal”. Our project, titled “Blue Lines + Future Coral” was a collaboration between Evan Finkle and Jeff Fossett of 90PERCENTART, along with our friend, Jesse Bryant. Here is how we summarized the project in our exhibit label: 

Blue Lines + Future Coral attempts to render sensible the growing socio-environmental problems involving water, the people of New York, and our climatic future. Like all issues related to climate change, these problems are both material and political. First, there is the increased material threat of flooding that will continue to rise as global temperatures increase. But second, there is the financial threat of “blue-lining”, or the commercial practice of incorporating flood models into profit calculations, and thus limiting access to flood insurance or 30-year mortgages based on estimations of future climate risk. 

This project combines flood data from projected sea level rise maps with US census data, interviews, and drawings to imagine future waves of climate-driven displacement within the neighborhoods of New York, and explore their uncertain consequences. At a macro level, we visualize New Yorkers as dots, initially washing away from the city as flood waters come in, but eventually re-aggregating as generative, coral-like forms that represent unknown future communities. We pair this with “on the ground” drawings and interviews taken from flood-prone areas of the city, where we ask anonymous New Yorkers to reflect on the question: “If there was a flood, where would you go?”
The image below shows what the project elements looked like in the gallery space. In the remainder of this post, we aim to give a bit more detail about the two major pieces of our project.

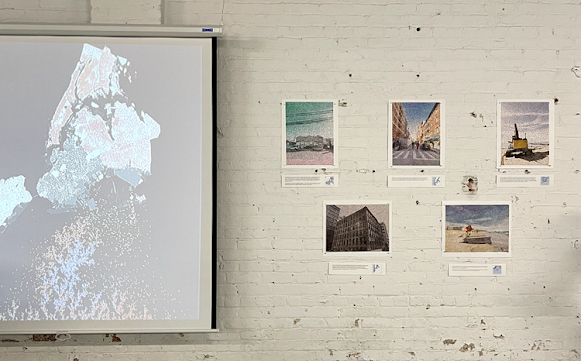
Blue Lines + Future Coral at The Hall gallery space in Brooklyn, NY
 
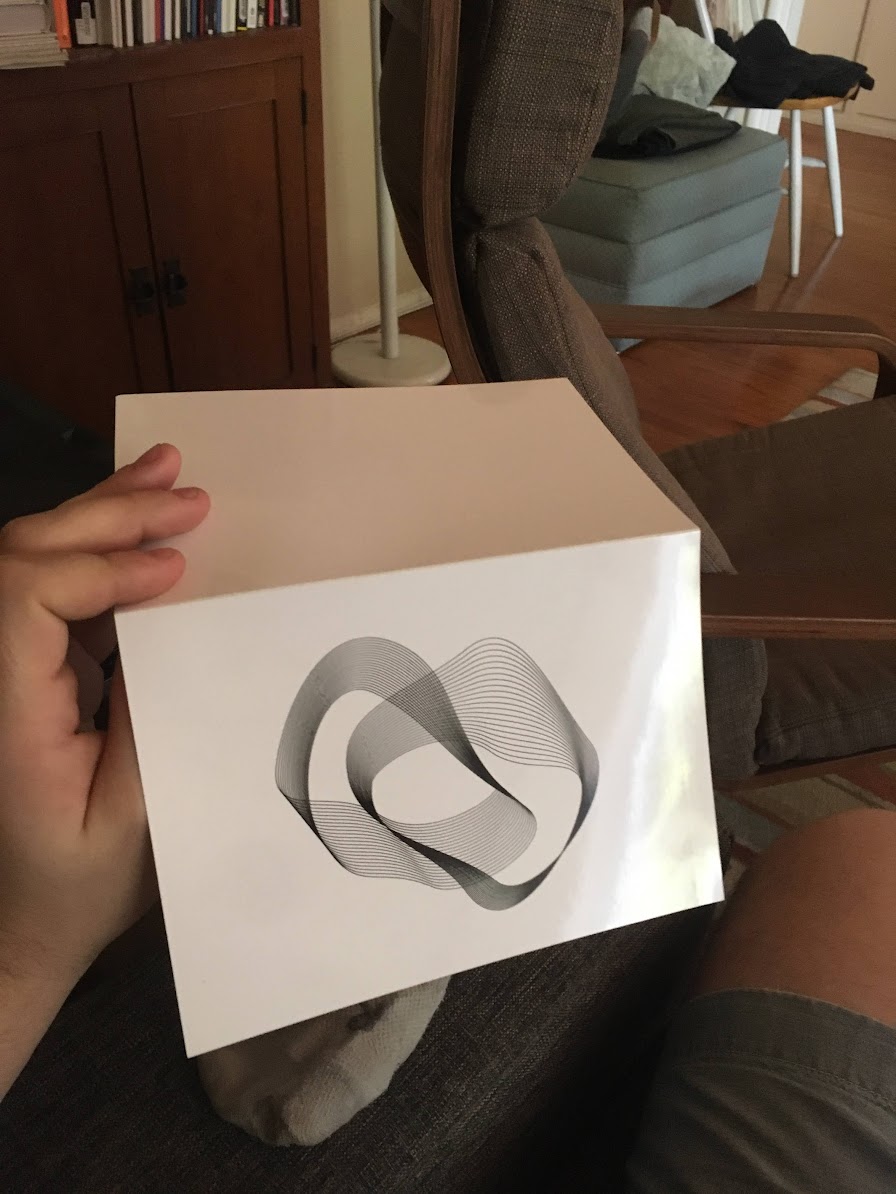
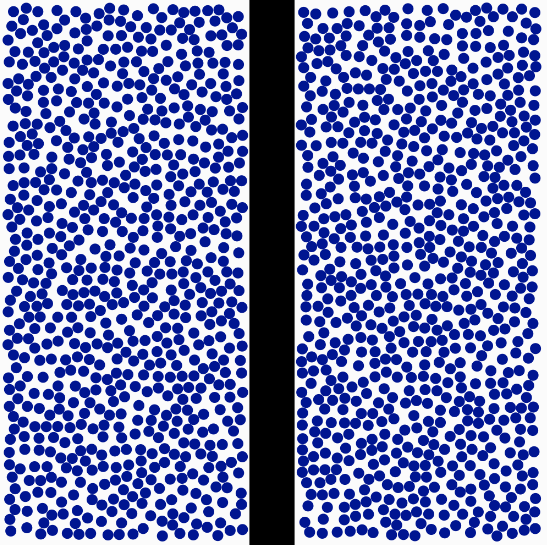
The first piece of our project was a dynamic data visualization combining real-world population data (from the US census), projected floodplain data from NYC Open Data, and generative art. In the visualization, New Yorkers are represented as dots, initially scattered across the city in line with population density. As flood waters come in, they are dislodged from their initial homes, and drift downward toward an imaginary sea floor, eventually re-aggregating in new procedurally-generated coral-like forms that represent unknown future communities that will be induced by the dual processes of flooding and blue-lining. You can watch the complete animation here.
 
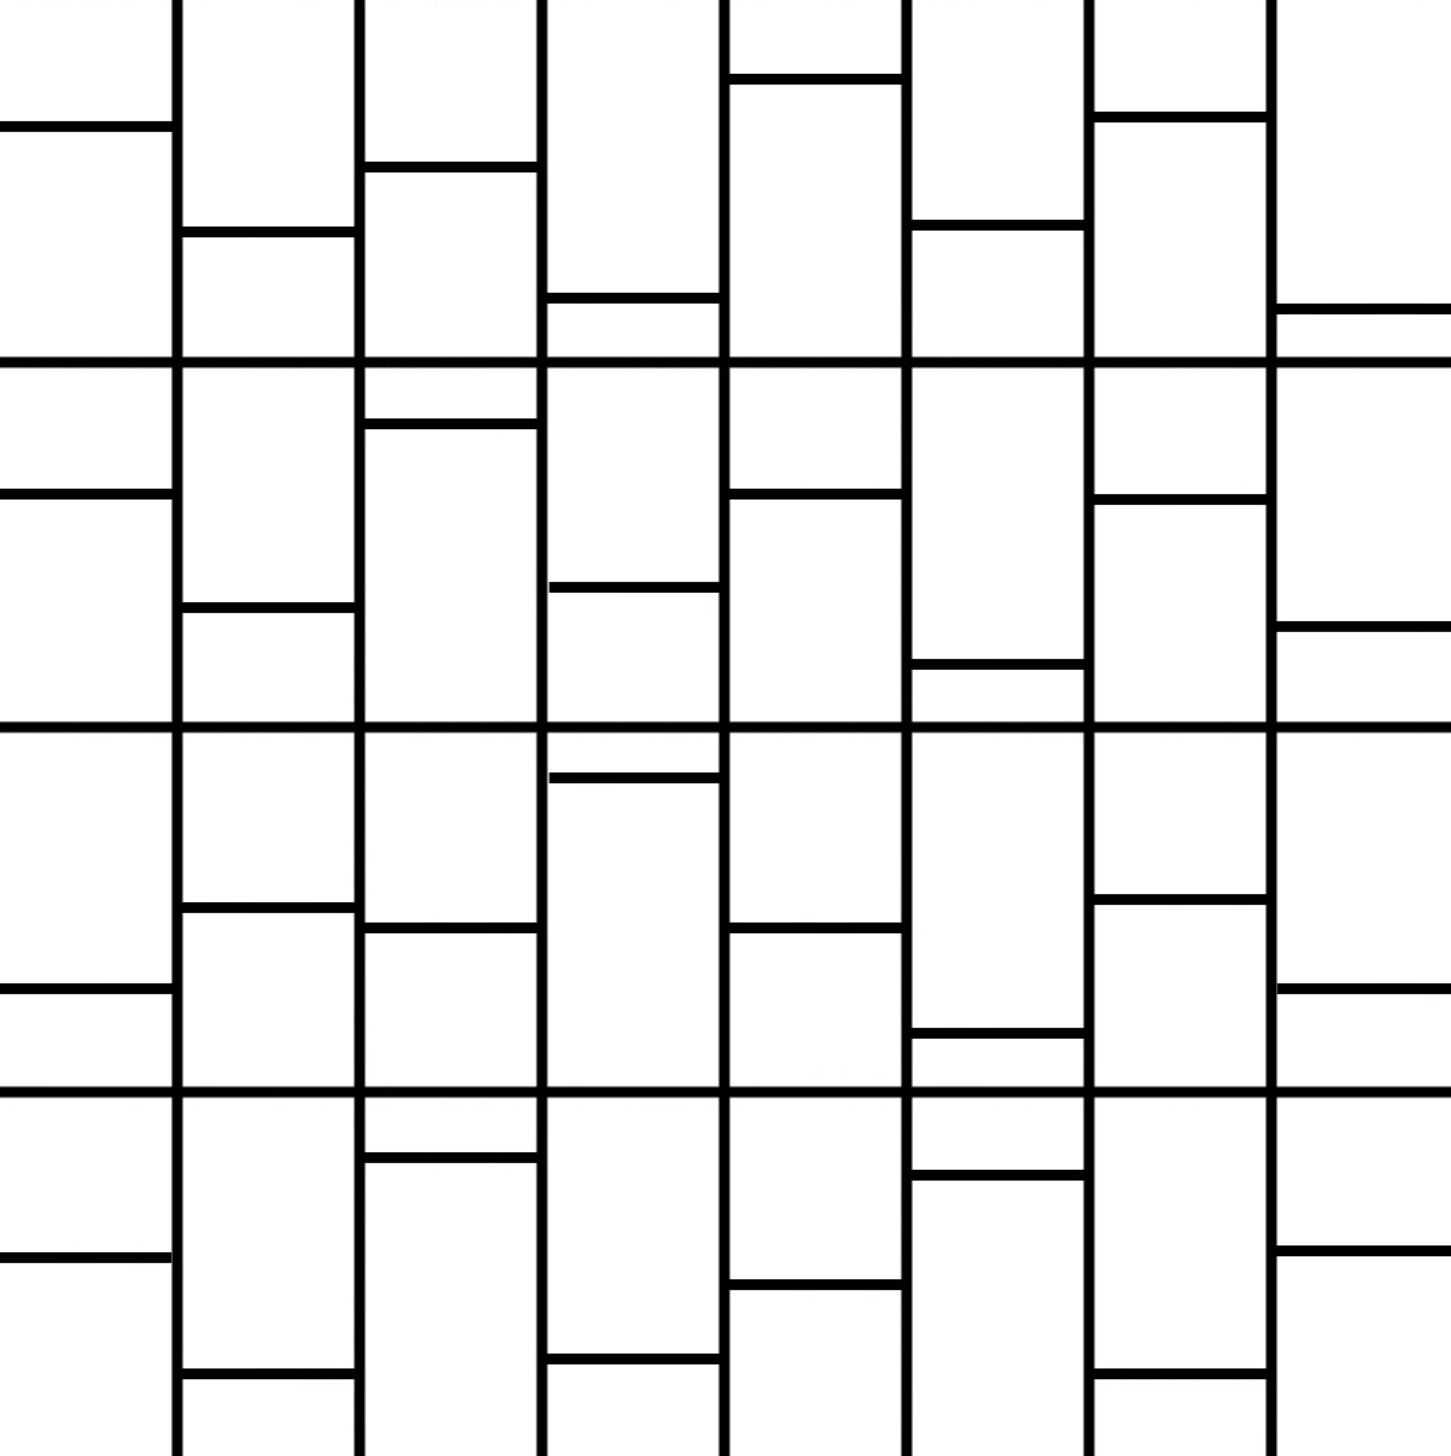
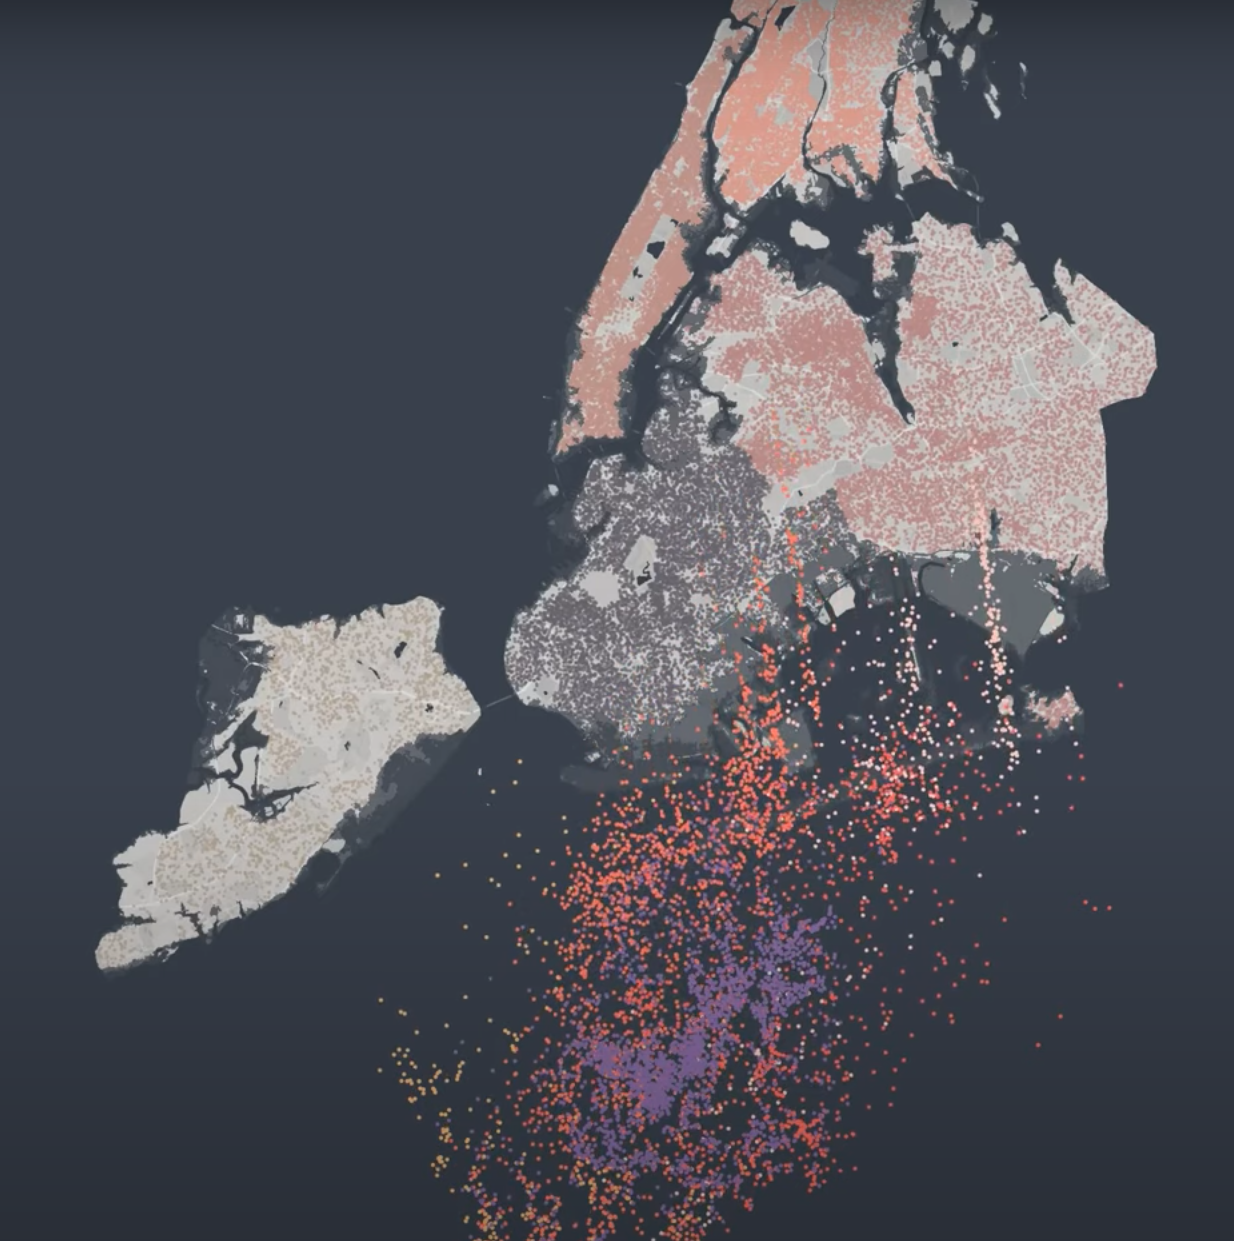
Screenshot from the Coral Animation (link to full animation)
 
Coral is an apt metaphor for representing the process of exodus and reconstitution of community. Why? Coral is a composite, symbiotic creature. Much of what we know as “coral” is made up in fact of two species, the coral polyp and resident photosynthetic zooxanthellae. While the coral provides protection and carbon dioxide to the zooxanthellae, the zooxanthellae provide the coral animal with sugar and oxygen. What we understand as different species of coral is instead what emerges as the result of different combinations of species of coral and different species of zooxanthellae. Without its symbiotic zooxanthellae partner, coral cannot thrive. In fact, the catastrophic coral bleaching so common today is not really coral dying, but instead the disintegration of their symbiotic agreement with zooxanthellae.

The migrants—more than likely people of color—that will be forced out of New York City due to flooding must be imagined not as listless refugees, but as potential members of other, perhaps new, symbiotic communities that will enable (and be enabled by) them to thrive. If the cities and communities where migrants will land are the coral polyps awaiting the flourishing of a new, yet-to-be-imagined composite community, then the New York City climate migrants are zooxanthellae, with everything and more to offer. 

Generative art also plays a central conceptual role in the project. While conventional statistical analysis often uses data to place tight quantitative boundaries on tractable statistical uncertainty (confidence intervals, p-values and so on), such tools struggle to capture the kinds of broad, qualitative uncertainty involved in imagining complex socioeconomic-environmental futures. Here, generative art steps in, using data to support the imagination in a different way. Each coral form in our animation is the result of a random, simulated process called diffusion-limited aggregation, with initial conditions based on the real NYC population distribution. We ran the process incrementally based on different extents of flooding and using a range of other parameter values to generate a varied range of coral-like forms. 

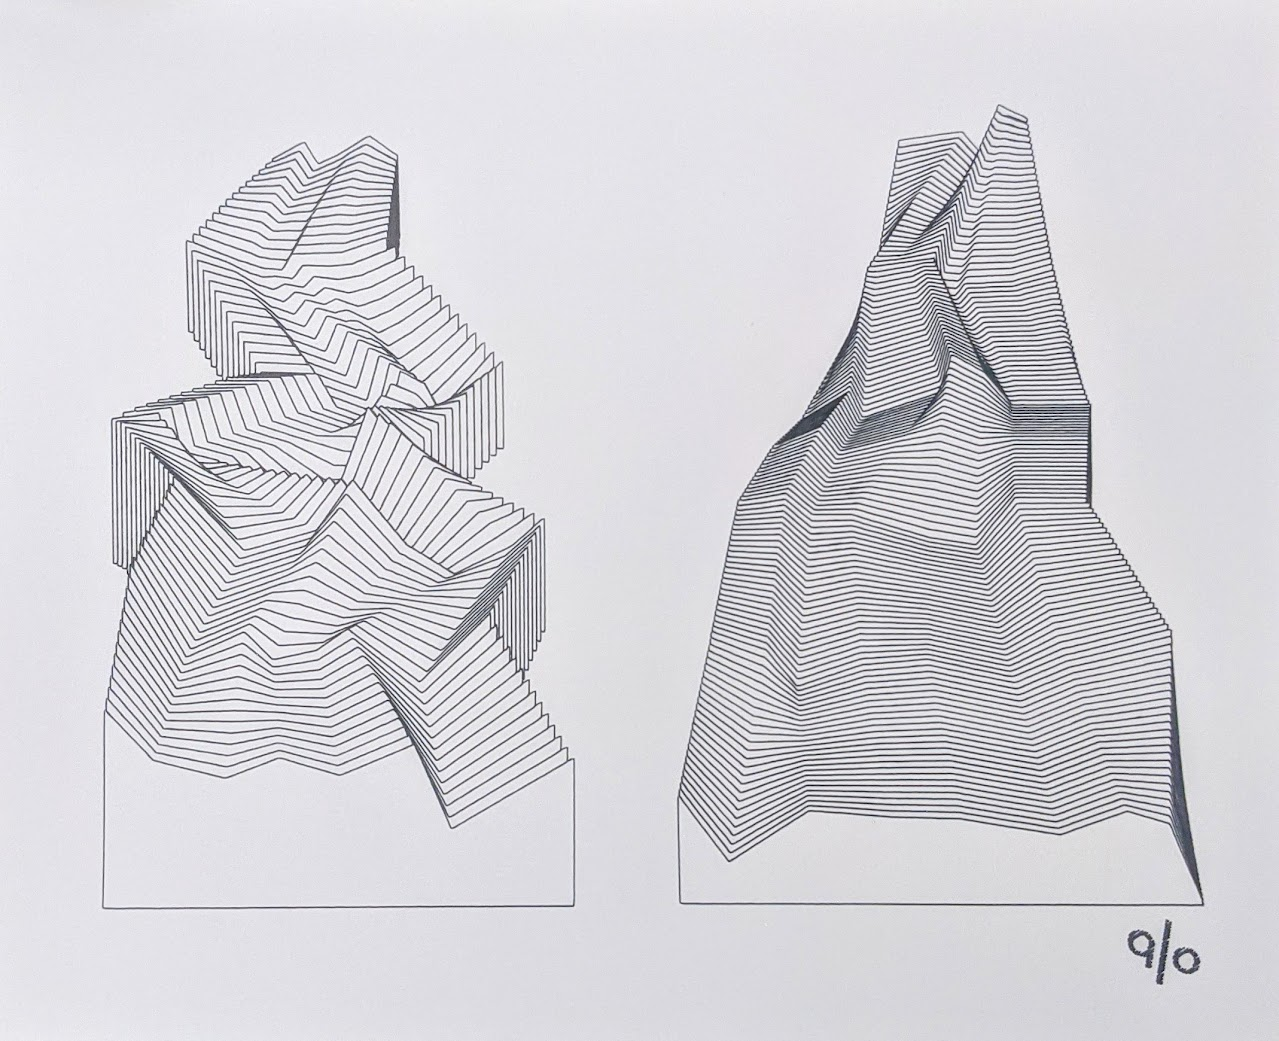
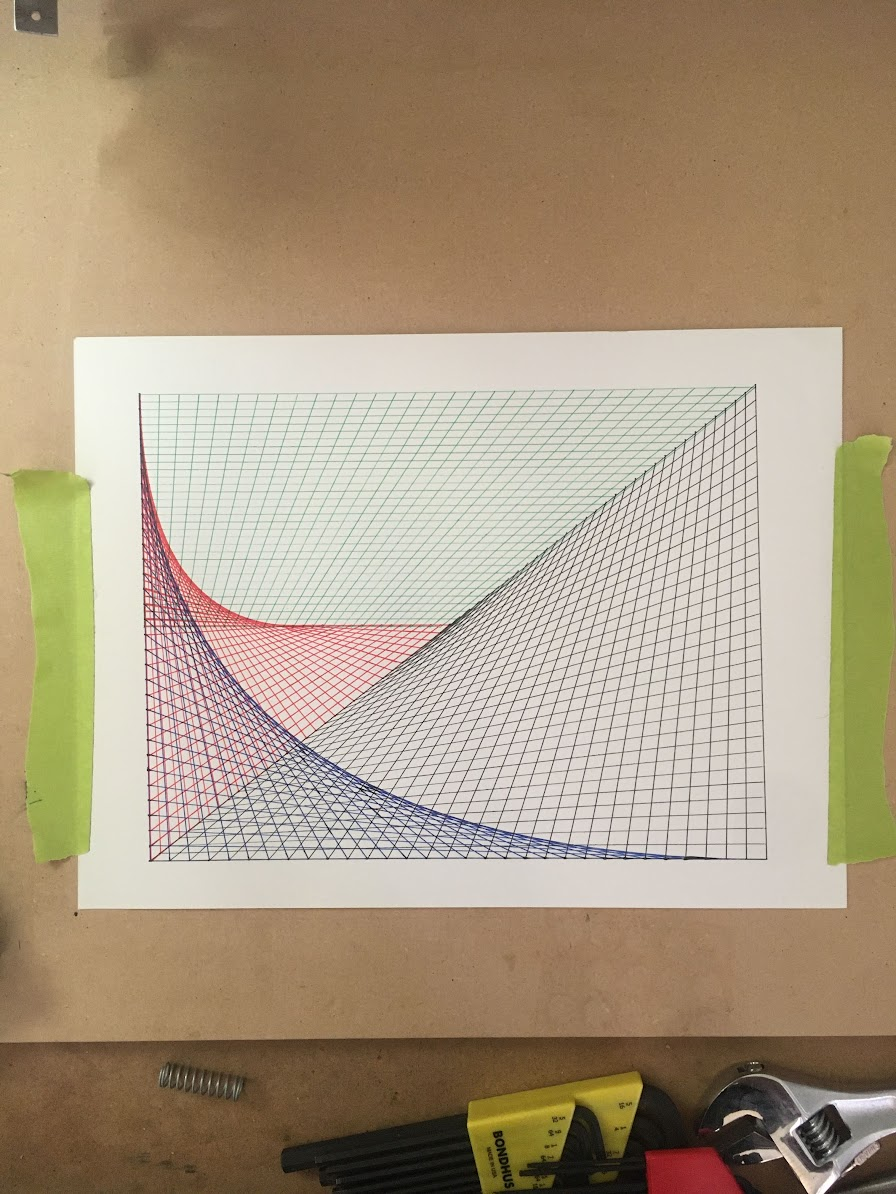
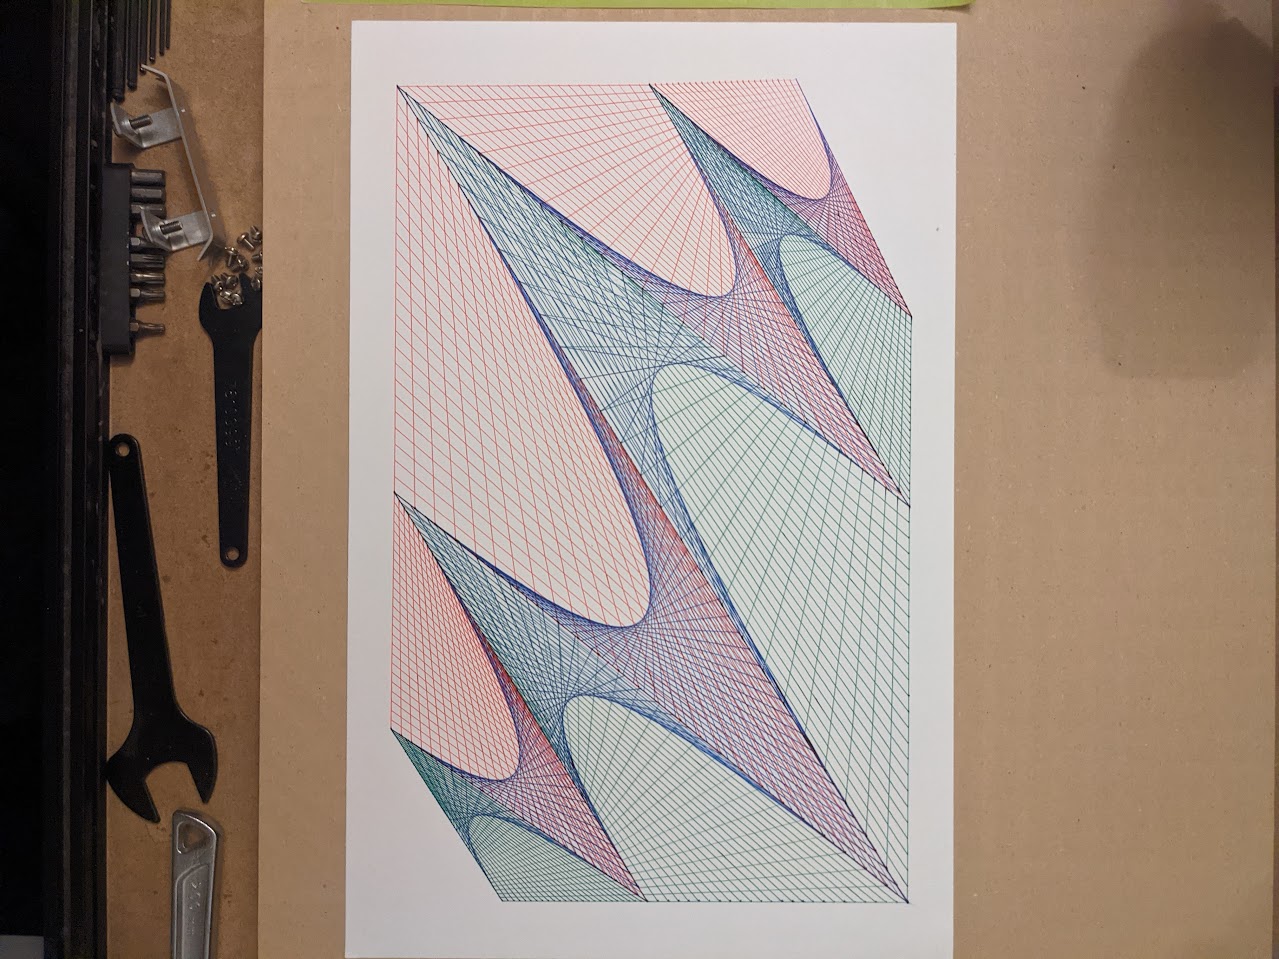
We paired the high-level digital component of our project with “on the ground” drawings and interviews taken from flood-prone areas of the city, where we asked anonymous New Yorkers to reflect on the question: “If there was a flood, where would you go?”
 
 
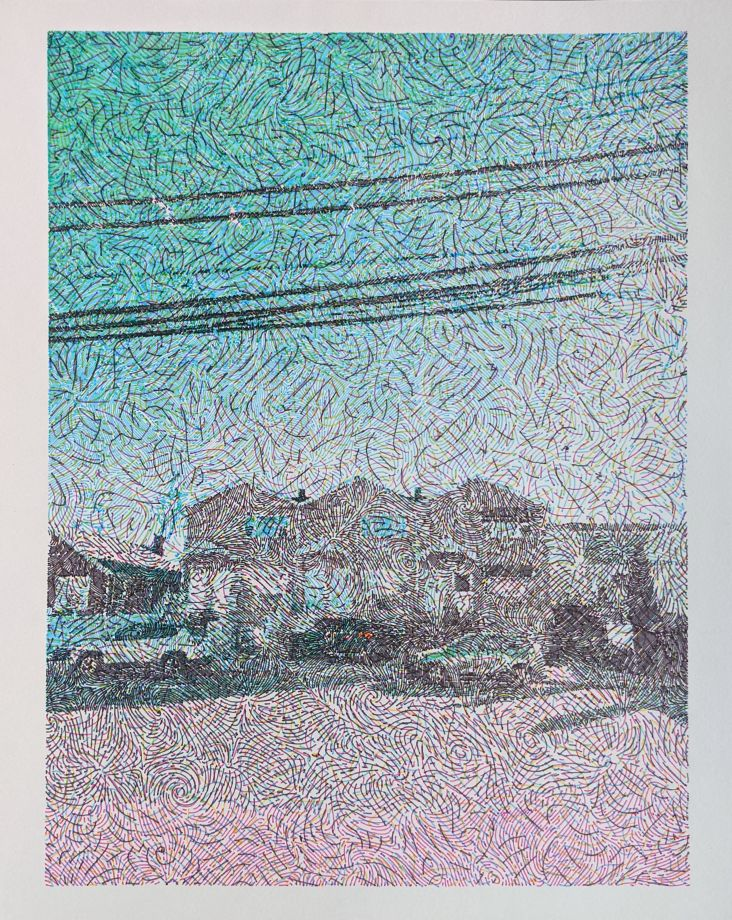
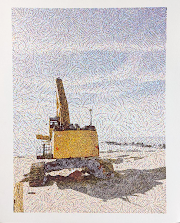
It was important to us to include these localized drawings alongside our high-level visualization in order to connect our project to real people and real places. We generated the drawings using creative coding tools based on original photographs we took in the city. We then rendered the drawings on the page using CMYK inks and a CNC pen plotter. Each was paired with a quotation from interviews with anonymous New Yorkers in the same area of the city. The interview quotes reflect uncertainty and imagination in its most basic human form, as New Yorkers wonder about unknown and unknowable climate plans and futures. 

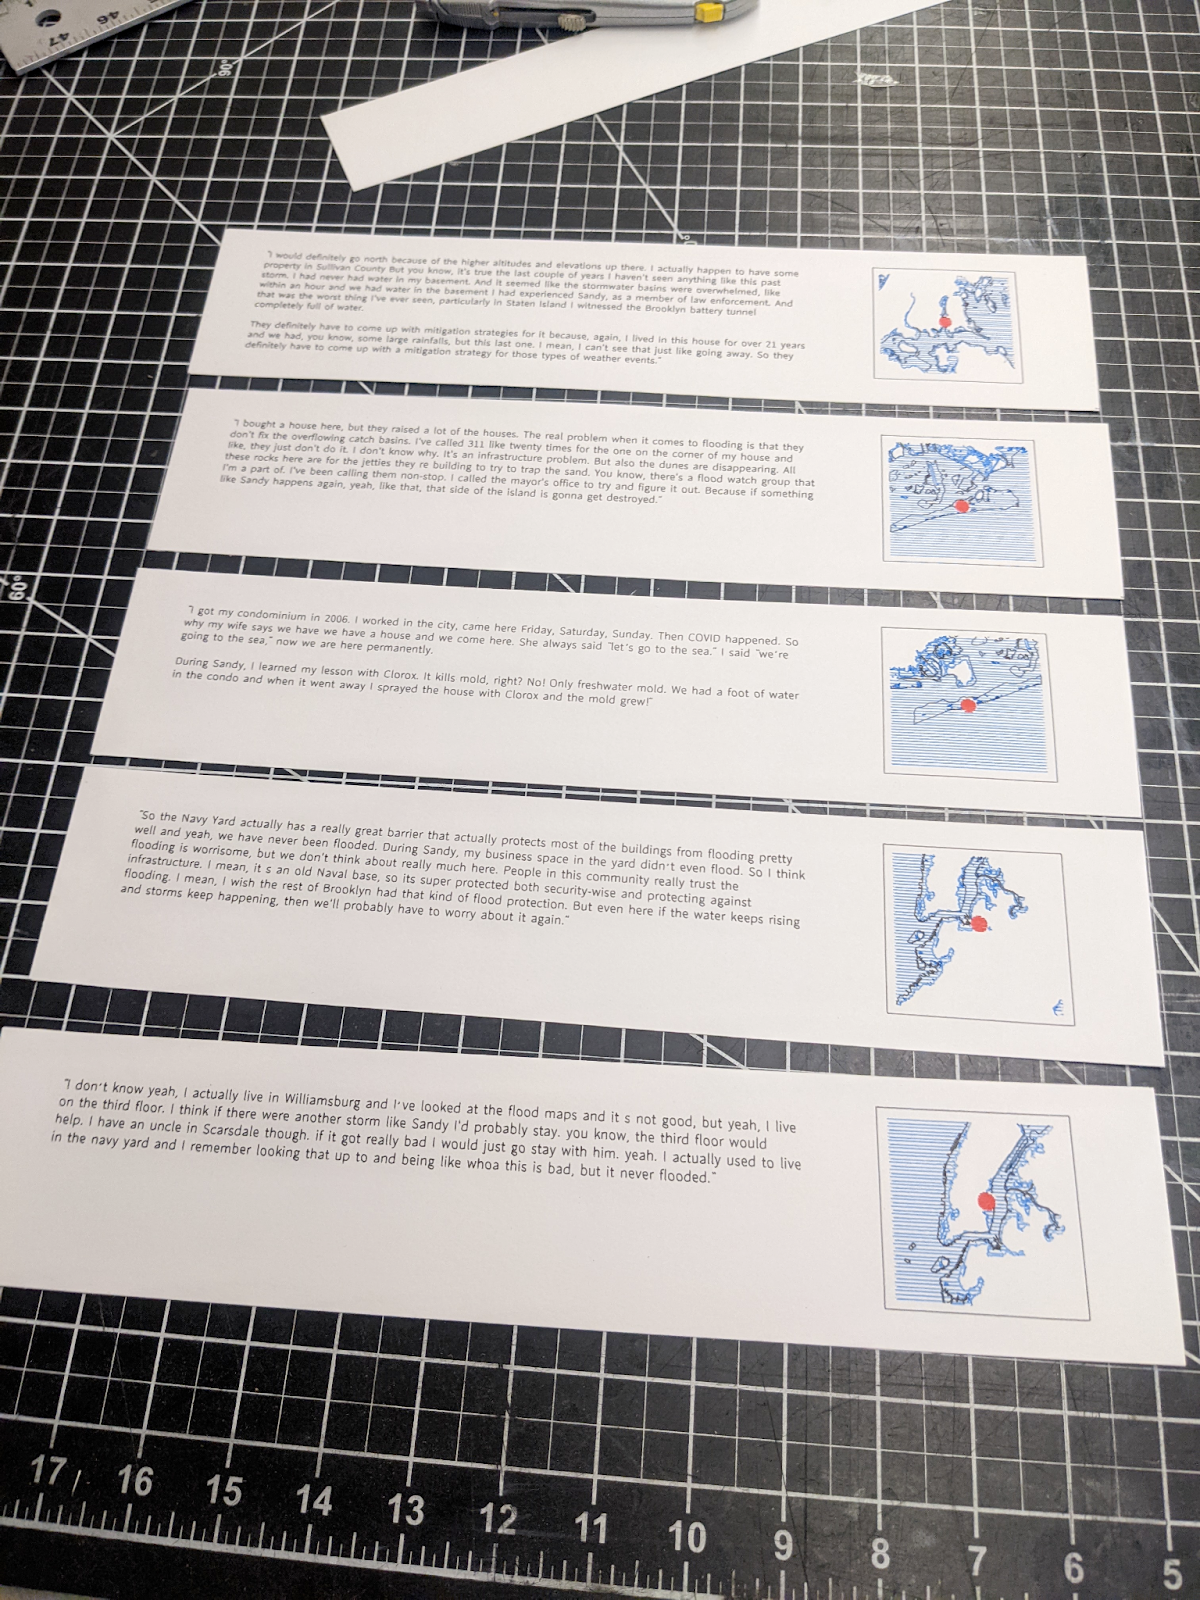
Interview quote excerpts that were displayed at the exhibit
 
We are grateful to the DxD organizers—and Rachel Daniell in particular—for their support of this project, for curating a fascinating selection of artworks (check them out!), and for organizing this event, including a very successful gallery opening that brought in several hundred guests. Thanks for allowing us to be part of this. 
 
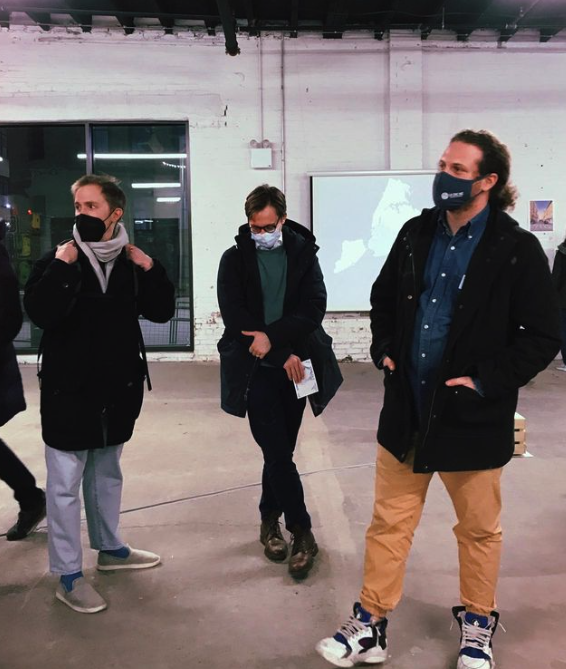
Two of us (Evan, right; Jeff, left) at the gallery opening event

Blend Work

Predating our generative phase, we found Illustrator to be a convenient and clever enough drawing tool to create arrays of lines between two curves. Essentially your options in the workflow are to define the quantity of subdivisions you'd like via some metric (quantity, distance of spacing) as well as the orientation of the iterations be they tangent to the spine of the blend or parallel to the curves at each end.

Pretty straight forward we suppose but a few blends get you a long way towards creating appealing geometric work fairly quickly. 

Here are some examples of blends and any tricks added to them for their effects:

Blend 1

This really was the first blend set-up we put together.. It had originally been drawn back in Providence in 2019, this one we printed on our Canon pro100 testing some cardstock printing.. anyways it's two very basic curve blends showing evenly incremented divisions between two curves. We learned that node placement can matter quite a bit as it defines the blended curves splines as well so you can adjust some of the flow of the blend by changing the spline handles of the parent curves.

Later Blend (6-8?)

Using four lines you can create a blended grid that conforms to the bounding box of the parent curves.. You can also create a bent grid by blending twice between four overlapping lines in two locations which we found to be a lot of fun for making warped illusions like this next image

These next blends were made using fills for each curve and after the blend was complete a boolean operation was used to leave just the outline information for pl0tb0t. We had originally drawn blends like these combining multiple parent lines into one large blend but were not able to draw them for some time until we figured out how to get around the occlusion problem. Glad it's sorted now but overlapping blends like all the previous images look great too.


All in all, we've plotted about 20 or so blends and they're a great exercise when we're feeling low on creative juice to try coming up with a new interesting curve set to blend with. It's an incredibly simple generative technique that we've gone on to keep using in our scripting.. subdividing, incrementing.. it was very nice to use a tool able to create these generations for us and it's nice having control over the parent curves before the blend occurs rather than having to seed your way through random generations.. Certainly you haven't seen the last of Blends from us..


Generative Sol

 For #genuary2022 day 7, we took the #generative mission to heart and used the @OpenAI API to GPT-3 to algorithmically generate *new* drawing instructions in the style of Sol Lewitt, which we then attempted to draw. Thread on our process  #creativecoding #p5js #genuary 1/


First, we grabbed the raw text of a bunch of Sol Lewitt drawing instructions from the “Solving Sol” GitHub repo (https://github.com/wholepixel/solving-sol). That landed us with 44 example instructions. 2/ 


Next, we fed these examples to the “completions” endpoint of the OpenAI API (https://beta.openai.com/docs/guides/completion). The completion endpoint is perfect for this task, as it’s able to take in a number of examples and generate more in the same style. 


At the end of our list of sample instructions, we prompted the model for a new “## Wall Drawing #” , and left it up to the model to choose a number, year and instructions. 


The model generates all sorts of instructions. Some are nonsense, or near-duplicates of existing Lewitt. But most are perfectly coherent. A few curated examples which we rendered in #p5js and Illustrator: 


Wall Drawing #945 (2001). Two red squares meeting at right angles within a black square.

Wall Drawing #943 (2001). Blue dots 1/4 inch (6 mm) in diameter in two columns separated by a black 1-inch (25 mm) wide band. The dots are placed as close together as possible in order to cover the wall. 


Wall Drawing #903 (1999). A wall divided horizontally and vertically into two equal parts. Top: a white square within which are white horizontal parallel lines, and a white rectangle within which are white vertical parallel lines. Bottom: a white square within which are white horizontal parallel lines and a white rectangle within which are white vertical parallel lines.


Wall Drawing #606 (1989). Ten pencils, ten colors. 10,000 pencil marks on a 40 x 40 inch (100 x 100 cm) square of black paper.


A few of the model outputs are quite funny if not very true to Lewitt. For example, the model’s “Wall Drawing #658 (1989)” calls for “Lines in three directions and two colors, in the style of Piet Mondrian.”

Others create contradictions but are almost interpretable; aside from drawing a “vertical band parallel to the horizontal axis” Wall Drawing #481 is nearly viable:


Wall Drawing #481 (1986). A vertical band parallel to the horizontal axis dividing the wall into two equal parts. Within each part, a band parallel to the vertical axis dividing the wall into two equal parts. Within each of those two parts, a band parallel to the horizontal axis dividing the wall into two equal parts. Within each of those two parts, a band parallel to the vertical axis dividing the wall into two equal parts. Within the innermost part, a band parallel to the horizontal axis.


Wera Tool Check PLUS adjustment

This is our follow up to a previous post; a plOtbOt optimisation of sorts, focusing on organization. We have a toolbox that sits near pl0tb0t and holds a variety of spare parts and utensils.

Generally it sits and collects dust acts as a second point of contact for go-to tools for the machine, outside of our primary tool's normal home: knolled around the borders of pl0tb0t's spoilboard.

The toolbox has held extra tools like a small driver set:

as well as some files and wrenches... and a handful of XCarve items like holddown clamps and older Arduino CNC shields:


 It has also held all sorts of pen fodder until recently.. With the new pen rig the box has lost some substantial view count, and it subsequently is going to be relagated to the hall 🥵!! 

The main hope today was to pull any last hot tool for the machine from the box if possible.. and after some thought, I felt with some modification the Wera toolcheck plus might be more usable than it's default config. It came with like... Torx security bits.. and a mess full of driver bits that wouldn't be helpful on pl0tb0t. Luckily in storage we have a sloppy supply if other options so it's time for adjustments!!

It may not look like much but added in is 7 subdivisions of the preexisting bit types.. 32nd Allen drivers, flats small enough for electrical headers.. long term it might be worth seeking out metric Allens which could eliminate the other remaining set of desk wrenches... They would likely replace the square drivers, which seem to be mostly for construction? 

All the options to go through are pictured below:

A comic collection, but luckily all back in their  storage box.

An organizational WIP.. but a proud release for now.

Documentation: a ramble

Some side work. Been meaning to begin any sort of streaming documentation outside of Instagram.. painful stuff over there. Draws a lot of patience. Working through the chores of good work is always a bit of a spiral. 

For today the best of it comes to a bag. 


It was a quick buy after having some Posca pens arrive to realize their home would likely be like... a toolbox half full of pen-related debris. The toolbox isn't gone yet.. and still holds a half set of simple drivers as well as some spare parts.. but for now.. pens. 

It turned into these layouts:


Second layout is silly, holding a pl0tb0t specific set of pilot G-2s removed from their sleeves to be held in a spring-loaded mount as pl0tb0t's current universal gripper isn't springloaded.. hopefully, iteration 2 comes soon enough? We're in planning and parting.. but that's issue (post, not problem) for another time! 


Nest_Egg

This was a bit of a journey. Far and away pl0tb0t's longest drawing. 4, 3 hour layers, nearing cmyk stippled imagery. Things missing from this build were balancing the color layers as well as there was no consideration for rosette configurations for smoothing color differences. 

Each layer has 6000, equally weighted points. There is a setting to control point weights as well but for this drawing all are equal. 

Results were mildly muddy and green was missed heavily, considering the source image. Also the speckles on the eggs didn't catch. On the upside, the nest had pieces of straw and grass shoe up texturally, and the eggs read.
final product

first layer

digital layer

Alpha layer - cyan 

Blue Lines + Future Coral

In March 2022, we were fortunate to be participating artists in Data Through Design (DxD) 2022 exhibit , titled “Ground Truth IRL” at The Ha...